
By September, expect many cultivation facilities to be idle and available cheap. We’re about to enter a very crowded market with no bottom in sight.
A recent column I wrote about factors that are actually driving the supply glut in Massachusetts spurred a lot of messages and emails. Specifically, there was sufficient interest in a deeper look at all the underlying data.
While the data set that I examined below is from the Bay State, the principles nevertheless apply to most markets, and especially new east coast markets that are, like Massachusetts, set up as so-called limited-license states.
(One mea culpa: In my last piece, I stated that canopy sizes for provisional licenses are not available. I was wrong and stand corrected. Apparently, that may have been the case a few years ago, but presently the Cannabis Control Commission’s open data platform provides canopy sizes for final and provisional licenses.)
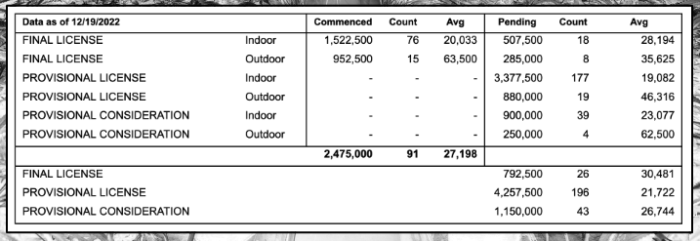
We downloaded the license database on Jan. 4, 2023. The data is current through Dec. 18, 2022. We filtered the data for Cultivation-class licenses only. Massachusetts has 11 cultivation tiers, each based upon canopy size (expressed in square footage – “SF”). A Tier 1 license allows up to 5,000 SF of canopy. A Tier 2 license allows between 5,001 and 10,000 SF of canopy. The remaining tiers are in 10,000 SF increments culminating at Tier 11 with 90,001 to 100,000 SF of canopy. We assumed each canopy is at its midpoint (Tier 1 is 2,500, Tier 2 is 7,500, Tier 3 is 15,000, and so on).
Massachusetts has final license, provisional license, and provisional consideration license categories. Provisional consideration implies that the license fee has not yet been paid. A final license is not the final step. After the final license comes the authorization to commence operations.
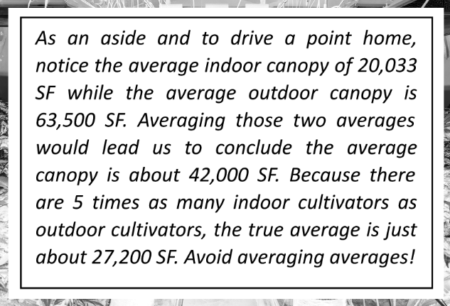 If you are in the cannabis business, understanding numbers will be very important as the markets contract and operators fight to survive. Never take an average of an average. Doing so is generally inaccurate and deceptive. For example, if the average price in month 1 is $400 per ounce, the average price in month 2 is $500 per ounce, and the average price in month 3 is $600 per ounce, averaging the three averages leads one to believe the average price per ounce is $500 ($400 + $500 + $600, divided by 3). But what if in month 1, we sold 10 ounces at an average of $400 per ounce ($4,000), in month 2 we sold six ounces at an average of $500 per ounce ($3,000), and in month 3 we sold four ounces at an average of $600 per ounce ($2,400). Our total revenue was $9,400 and the total volume sold was 20 ounces. The actual average price per ounce is $470, not $500. As soon as a key metric, in this case volume, varies by month, averaging the averages will lead to an incorrect outcome. Learn that lesson. It is how slick salespeople will bamboozle you.
With this quick foundation, let’s dive into the numbers …
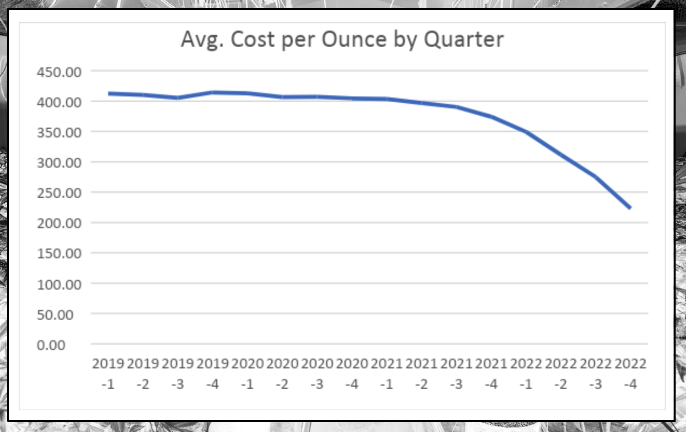
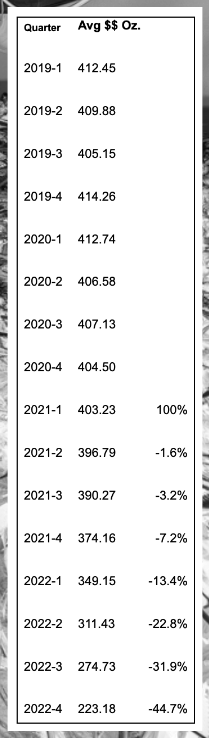
First, look at the average cost per ounce of flower at retail prices (we don’t know how volume varied by the day, but will assume volume was equal). From 2019 through the first quarter of 2021, prices were generally stable. Notice how prices started to drop in the third quarter of 2021 and then quickly pick up speed. From the fourth quarter of 2021 to the fourth quarter of 2022, prices dropped 40%. By Q4 2022, prices had dropped 44.7% from Q1 2021. The drop is accelerating and likely isn’t going to slow down.
Notice how the average prices began to drop in early 2021 and picked up steam in the third quarter. By 2022, prices were heading down a black diamond trail.
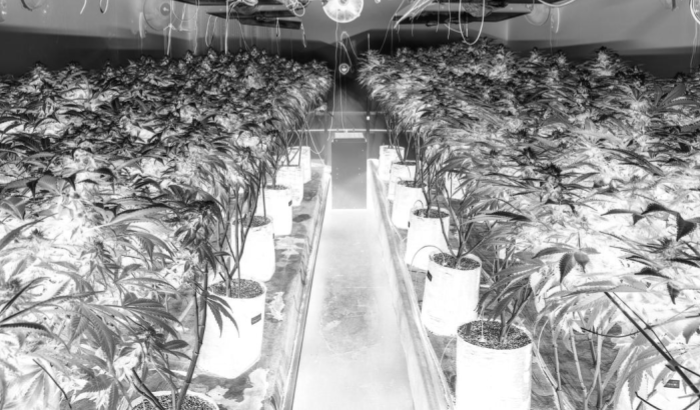
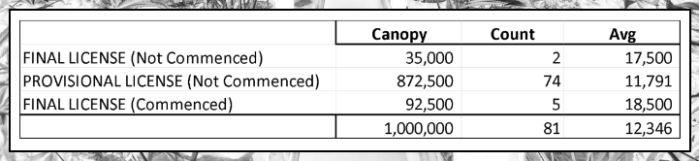
 Now let’s look at cultivation capacity, as we believe capacity is the true culprit of the price crash. As of Dec. 19, 2022, the CCC’s open data platform reported 2.475 million SF of canopy (using the midpoint of each tier) across 91 cultivation licenses. Mass is experiencing a steep price decline with 2.5 million SF of canopy operational. Waiting just behind that production capacity is another near one-third—about 800,000 SF of canopy with final licenses—meaning the facility is likely fully built out, and is just awaiting an authorization to commence operations.
Imagine what happens to prices if production grows by a third. That’s about 3.3 million SF of canopy. Behind that is a staggering 4.25 million SF of provisionally licensed canopy. Much of that canopy may never be completed; the operators might not have all the capital they need to finish. But some of it certainly will come online. While behind those provisional licenses are applications that have not yet been approved, and behind that group are teams that are working to secure municipal approvals so they can apply.
By September 2023, we expect many cultivation facilities will be idle and available cheap—with no buyers. If you’re investing in cultivation assets, do your homework. You’re about to enter a very crowded market with no bottom in sight.
Interestingly, several cultivation licenses have lapsed, though the impact on canopy is minimal. It appears 92,500 SF of current canopy might be non-operational and 907,500 of provisionally licensed canopy will not become operational. That still leaves 3.35 million SF of provisionally licensed canopy. Even with these considerations, it appears the glut will only increase.
Anecdotally, in the first week of December I visited a local cannabis retailer. Armed with some advice from some legacy friends, I placed my order and asked to see the lab label. Specifically, I was interested in the test dates and packaging dates.
On his first two trips to the inventory room, the budtender brought out products that had been tested in March and packaged in September. On the third trip, he found a product that had been tested on Sept. 24 and packaged Nov. 18. The second item was tested Aug. 3 and packaged Dec. 6. Think about how much excess product is sitting around when a cultivator has the product tested in March, but not packaged for six months.
Even the “fresh” flower was packaged two months after it was tested. Aside from the degradation in potency that I understand starts to take place after 8 to 10 weeks, this lag would never have taken so long in 2019 or 2020 when product was tight and demand was still strong.
At its heart, cannabis is an agricultural product and ag products tend to be perishable. That means product will soon need to be processed or sold to avoid a total loss. If that retailer (a single data point) is any indication of how much excess product is in cannabis vault rooms, adding an additional one-third more production capacity could become a consumer’s dream, as prices will have to go awfully low to move that inventory.
As much as I write about interstate commerce, it likely won’t be here in time to provide new markets for and bail out Mass cultivators with excess product. In the meantime, grab your pipes and bongs, because the fire sale is coming.